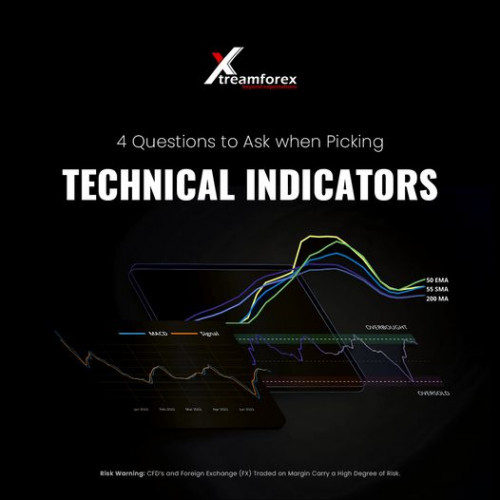
Remember that you may always combine and adjust indicators to create a consistently lucrative approach. The options are limitless. But, before you become overwhelmed by all the alternatives, start by answering these four crucial questions first:

1.What do you want to use the indicator for?
If you wish to track trends, moving averages may be the best solution. If you enjoy predicting market peaks and bottoms, oscillators such as Stochastic or RSI may be your best choice.

2. Do you know how the indicator works?

You don't need to memorize the intricate formulae, but knowing what sort of data goes in (for example, the average of the last X closing prices or the ratio of highs vs. lows in the previous X bars) can help you comprehend what kind of data is produced.

3. When does the indicator fail?

Moving averages, for example, do not provide trustworthy signals in rangebound markets, thus relying solely on crossings may lead to erratic price activity. Some oscillators predict reversals too early, making you vulnerable to fake outs if you use leading indicators with incorrect settings.

4. What settings should you use?

Where is the ideal balance between this wide range of sensitive and frequently faulty signals on one end and trailing but more reliable signals on the other? Some argue that the default settings are frequently the best because they are what most market observers use anyhow. This implies that they often have a self-fulfilling impact.
89 צפיות

4 Questions To Ask When Picking Technical Indicators

הועלה לפני 1 חודש

Remember that you may always combine and adjust indicators to create a consistently lucrative approach. The options are limitless. But, before you become overwhelmed by all the alternatives, start by answering these four crucial questions first:

1.What do you want to use the indicator for?
If you wish to track trends, moving averages may be the best solution. If you enjoy predicting market peaks and bottoms, oscillators such as Stochastic or RSI may be your best choice.

2. Do you know how the indicator works?

You don't need to memorize the intricate formulae, but knowing what sort of data goes in (for example, the average of the last X closing prices or the ratio of highs vs. lows in the previous X bars) can help you comprehend what kind of data is produced.

3. When does the indicator fail?

Moving averages, for example, do not provide trustworthy signals in rangebound markets, thus relying solely on crossings may lead to erratic price activity. Some oscillators predict reversals too early, making you vulnerable to fake outs if you use leading indicators with incorrect settings.

4. What settings should you use?

Where is the ideal balance between this wide range of sensitive and frequently faulty signals on one end and trailing but more reliable signals on the other? Some argue that the default settings are frequently the best because they are what most market observers use anyhow. This implies that they often have a self-fulfilling impact.

Tip: Use Image link when sharing on other sites. Image URL has limited bandwidth.
ערוך או שנה את גודל התמונה על ידי לחיצה על התמונה או אייקון העריכה
ערוך או שנה את גודל התמונה על ידי לחיצה על תצוגה מקדימה או אייקון העריכה
העלאת 0 תמונה (0% הושלם)
התמונות בהעלאה, יקח כמה שניות עד שתקבל לינק להורדה\הטמעה
העלאה הושלמה
התמונות שהועלו, התווספו לאלבום הינך יכול ליצור אלבום חדש אלבום חדש עם התוכן שהועלה.
התמונות שהועלו, התווספו לאלבום
הינך יכול ליצור אלבום חדש אלבום חדש עם התוכן שהועלה. You must create an account or היכנס to save this content into your account.
תקלה בעת העלאת קבצי תמונה, נסה שוב
Some errors have occurred and the system couldn't process your request.
    הירשם to be able to create private albums and delete images after upload.
    או ביטולבטל את העלאה
    שים לב: חלק מהתמונות לא הועלו למד עוד
    עיין ב- דו"ח השגיאות למידע נוסף.
    JPG PNG BMP GIF WEBP 50 MB