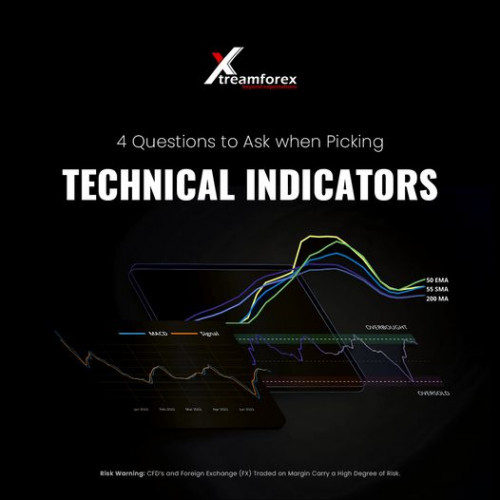
Remember that you may always combine and adjust indicators to create a consistently lucrative approach. The options are limitless. But, before you become overwhelmed by all the alternatives, start by answering these four crucial questions first:

1.What do you want to use the indicator for?
If you wish to track trends, moving averages may be the best solution. If you enjoy predicting market peaks and bottoms, oscillators such as Stochastic or RSI may be your best choice.

2. Do you know how the indicator works?

You don't need to memorize the intricate formulae, but knowing what sort of data goes in (for example, the average of the last X closing prices or the ratio of highs vs. lows in the previous X bars) can help you comprehend what kind of data is produced.

3. When does the indicator fail?

Moving averages, for example, do not provide trustworthy signals in rangebound markets, thus relying solely on crossings may lead to erratic price activity. Some oscillators predict reversals too early, making you vulnerable to fake outs if you use leading indicators with incorrect settings.

4. What settings should you use?

Where is the ideal balance between this wide range of sensitive and frequently faulty signals on one end and trailing but more reliable signals on the other? Some argue that the default settings are frequently the best because they are what most market observers use anyhow. This implies that they often have a self-fulfilling impact.
175 views

4 Questions To Ask When Picking Technical Indicators

Uploaded 8 months ago

Remember that you may always combine and adjust indicators to create a consistently lucrative approach. The options are limitless. But, before you become overwhelmed by all the alternatives, start by answering these four crucial questions first:

1.What do you want to use the indicator for?
If you wish to track trends, moving averages may be the best solution. If you enjoy predicting market peaks and bottoms, oscillators such as Stochastic or RSI may be your best choice.

2. Do you know how the indicator works?

You don't need to memorize the intricate formulae, but knowing what sort of data goes in (for example, the average of the last X closing prices or the ratio of highs vs. lows in the previous X bars) can help you comprehend what kind of data is produced.

3. When does the indicator fail?

Moving averages, for example, do not provide trustworthy signals in rangebound markets, thus relying solely on crossings may lead to erratic price activity. Some oscillators predict reversals too early, making you vulnerable to fake outs if you use leading indicators with incorrect settings.

4. What settings should you use?

Where is the ideal balance between this wide range of sensitive and frequently faulty signals on one end and trailing but more reliable signals on the other? Some argue that the default settings are frequently the best because they are what most market observers use anyhow. This implies that they often have a self-fulfilling impact.

Tip: Use Image link when sharing on other sites. Image URL has limited bandwidth.
Edit or resize any image by clicking the image preview
Edit any image by touching the image preview
Uploading 0 image (0% complete)
The queue is being uploaded, it should take just a few seconds to complete.
Upload complete
Uploaded content added to . You can create a new album with the content just uploaded.
Uploaded content added to .
You can create a new album with the content just uploaded. You must create an account or sign in to save this content into your account.
No image have been uploaded
Some errors have occurred and the system couldn't process your request.
    Sign up to be able to create private albums and delete images after upload.
    or cancelcancel remaining
    Note: Some images couldn't be uploaded. learn more
    Check the error report for more information.
    JPG PNG BMP GIF WEBP 50 MB